The market of perfect competition is an ideal model and therefore is extremely rare. With large assumptions, the stock market and the market for agricultural products can be attributed to the market of perfect competition.
But, despite the apparent ideality, the market of perfect competition has both advantages and disadvantages.
- Perfect Competition in the Market: Advantages ans Disadvantages
- Characteristics of the Perfect Competition Market
- Perfectly Competitive Market: the Company’s Competitive Strategy in the Short-run
- Perfect competition market: Competitive Strategy of the Company in the Long Run
Perfect Competition in the Market: Advantages ans Disadvantages
The advantages of the perfect competition are:
- The biggest advantage is the achievement of market equilibrium, when there is no shortage and surplus of goods.
- In addition, striving to maximize profits, firms approach the issue of using economic resources very carefully and scrupulously: they compare their marginal costs and marginal revenue, and find the most efficient volume of production and the optimal use of resources.
- The flexibility of a perfectly competitive market. When consumer preferences change, the firm immediately adapts to new conditions or leaves this market and moves to the segment where its efforts are more needed by society.
- The market of perfect competition is capable of self-regulation and can function without government intervention.
But in addition to all the above advantages, the market of perfect competition has several disadvantages:
- Small firms. Such firms usually seek to minimize costs and save on innovative developments and research.
- Small firms cannot take advantage of the economies of scale that larger firms have.
- The company has the opportunity to leave this market at any time, so there is no need to think about tomorrow.
- There are no entry and exit barriers. It leads to the fact that it is not always possible to use the necessary measures of public regulation in the form of environmental protection or product quality assurance.
- Since the goods presented in the market of perfect competition are standardized and homogeneous, the consumer cannot satisfy all the variety of his needs.
Characteristics of the Perfect Competition Market
Features of the perfect competition are:
- There are a significant number of sellers and buyers who freely enter into a sale-purchase relationship.
- This is a market for a standardized product, that is, one that has no close substitutes. Due to standardization, there is no basis for non-price competition (competition based on differences in product quality, advertising, sales promotion, etc.).
- The price of the goods is set by the free interaction of market demand and supply.
- The absence of barriers to entry into this market or barriers to exit from it.
- A single firm cannot influence the price level.
- Perfect awareness of sellers and buyers about market conditions.
- Mobility of production resources.
Read posts:
“What Is Monopolistic Competition: Definition, Features, Examples, Diagrams.”
“What Is Oligopoly Market: Definition, Characteristics, Types, Barriers to Enter.”
Profit Maximization in a Perfectly Competitive Market
A firm that operates under perfect competition is called competitive. Its main goal is to maximize profit, which is the difference between total revenue and total costs for a certain period.
Total revenue is the amount of income received by a company from selling a certain amount of goods.
TR=P*Q,
where P is the price,
Q – sales volume.
Average revenue is income per unit of goods sold. Under conditions of perfect competition, average revenue equals price:

Marginal revenue is the ratio of changes in total income to changes in sales volume.
Under perfect competition, marginal revenue equals price:

Total Income Graph
The angle of the straight line depends on the price.

Total income increases in direct proportion to sales volume, so its graph has the shape of a ray emerging from the origin.
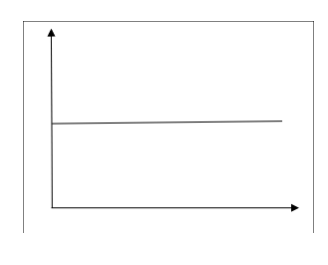
Graph of Average Revenue, Marginal Revenue and Price
In conditions of perfect competition, none of the producers can influence the price of the product. The price is formed regardless of producers and their production volumes, therefore the graph of the dependence of price, average revenue, and marginal revenue on production volumes is depicted as a straight line parallel to the x-axis:
Perfectly Competitive Market: the Company’s Competitive Strategy in the Short-run
Profit Pr is equal to the difference between total income (sales revenue) and total production costs:
Pr = TR – TC
To achieve maximum profit from the sale of a product or service, a company must first find answers to the following questions:
- At what production volume can maximum profit be achieved?
- What will be the result of the company’s activities at a certain price?
- Is it worth producing at all?
Thus, the main task of the company is to choose the most optimal production volume. It can be done using one of the following methods:
- Comparison of total revenue and total costs.
- Comparison of marginal revenue and marginal cost.
METHOD 1. Comparison of total revenue and total costs

Analyzing the graph, we can draw the following conclusions:
- The company will start making a profit at production volumes Q3-Q5.
- Maximum profit will be achieved when the difference between total revenue and total costs is maximum. The optimal production volume is Q4.
- The firm incurs losses between 0 and Q3 because total costs exceed total revenue.
- Profit equals 0 when total costs equal total revenue (these are production volumes Q3 and Q5).
- At production volume Q1, the company should suspend production, since losses are greater than fixed costs FC.
Summarize. The optimal production volume corresponds to the area of maximum distance between the lines of total revenue and total costs.
METHOD 2. Method of comparison of Marginal Revenue and Marginal Cost
The choice of a company’s behavior can also be made based on a comparative analysis of the marginal revenue and marginal costs of the company.
Production equilibrium and profit maximization are achieved in the case of equality of marginal revenue and marginal costs:
MR = MC
If marginal revenue is greater than marginal cost, then the additional profit from the sale of each additional unit of output has a positive value, increasing the amount of total profit, so production should continue:
MR > MC
If marginal revenue is less than marginal cost, then the sale of each additional unit of output is unprofitable. If the additional profit is negative, then it follows that the size of the total profit decreases, and production must be reduced:
MR < MC
Perfect competition market: Competitive Strategy of the Company in the Long Run
In the long run, all productive resources are mobile, and firms can enter or leave industries. The possibility of a separate company making a profit in the short run attracts new sellers to the industry, and as a result the prices will decrease.
When the price becomes less than the average total cost, production becomes unprofitable, firms leave the industry, and the price rises, resulting in a long-run price equal to the average cost of production:
MR = MC = P = ATC
where ATC is the average production cost;
MR – marginal revenue;
MC – marginal cost.

Graph of the equilibrium position of a competitive firm in the long run

P. S.: If you liked the post, please, share it with your friends, thank you! Have a nice day!